10+ Help Desk Metrics To Measure Support Performance On Shopify
10+ Help Desk Metrics To Measure Support Performance On Shopify
Help desk metrics serve as invaluable tools in evaluating the performance of customer service teams, particularly in the Shopify platform. These metrics can offer actionable insights to optimize support operations and elevate service standards. By understanding these metrics, Shopify merchants can enhance their support capabilities, foster stronger customer relationships, and ultimately drive growth in this competitive marketplace.
In today’s article, we will explore 10+ essential help desk metrics on Shopify and how to measure them.
Why Help Desk Metrics Matter?
In this section, we will analyze the benefits of measuring help desk metrics for three parties: C-level executives, middle managers/leaders, and team members

10+ Must-Track Help Desk Metrics On Shopify
There are 3 standout categories of help desk metrics on Shopify: productivity metrics, performance metrics, and experience metrics. Let’s break these down to learn more!
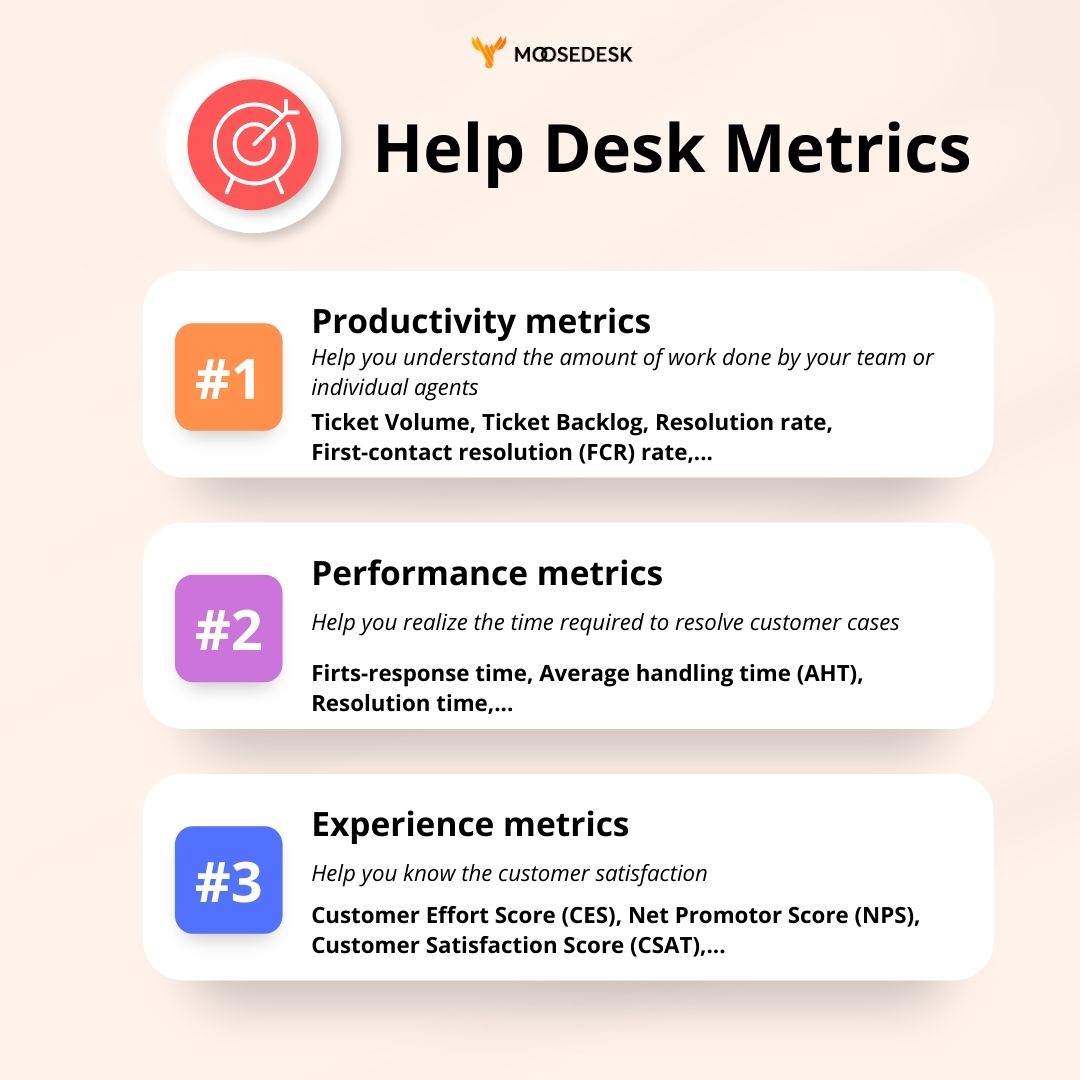
A. Shopify Help Desk Metrics About Productivity
Ticket volume
Ticket volume is the total number of support tickets or customer inquiries received within a specific period on Shopify. This help desk metric tells you how frequently your customers encounter issues that require the help of a support agent.
Moreover, analyzing your ticket volume helps you identify trends and pinpoint peak seasons when queries surge. This enables you to adjust staffing levels, preventing overworking during peak times.
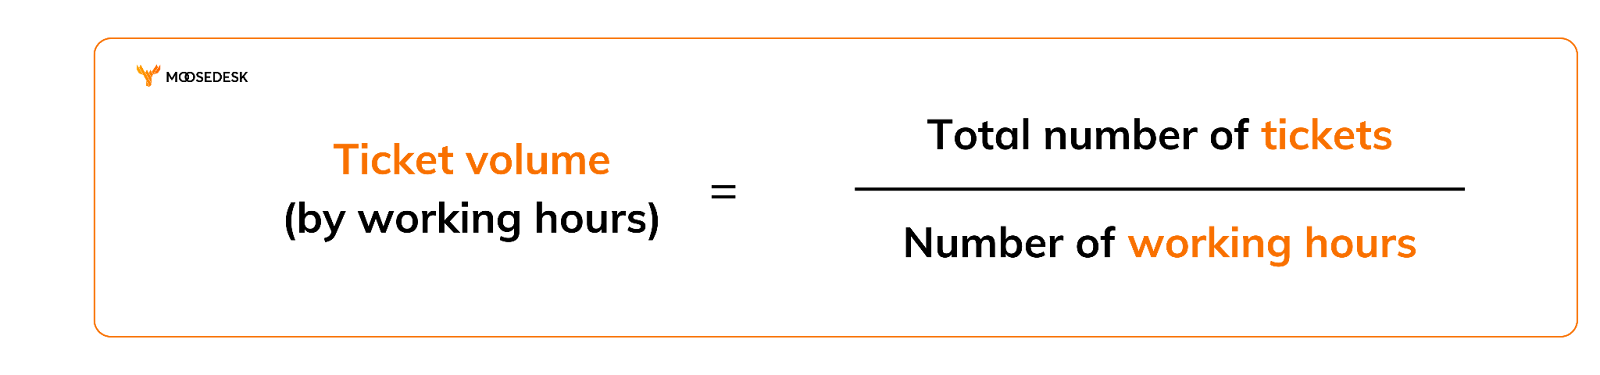
Ticket volume by working hours
Ticket volume by working hours measures the number of support tickets managed during specific work periods. These metrics help understand how workload varies throughout the workday, assisting teams in resource allocation.
Ticket volume by working hours = Total number of tickets / Number of working hours
Example:
If you have 100 tickets received in a day and your working hours are 8 hours.
The ticket volume by working hours in this case = 100 / 8 = 12.5 tickets per working hour
Ticket volume by channels
This helpdesk metric measures the number of customer inquiries received through each available support channel, such as email, live chat, Instagram, Facebook,…
Understanding the channel volume provides valuable insights into customer preferences regarding communication channels when seeking assistance.
Ticket backlog
Ticket backlog is the total number of customer support tickets that remain unresolved within a defined timeframe.
Tracking this help desk metric enables you to promptly resolve your customer’s issues.
Ticket backlog = Total number of unresolved tickets
(including tickets you have responded to, but haven’t closed)
Resolution rate
The resolution rate measures how many tickets have been fully resolved out of the total number of tickets. A higher resolution rate indicates that a large proportion of customer inquiries or problems are being effectively resolved.
Resolution rate = (Number of resolved tickets / Total number of tickets) * 100%

For instance:
If an agent resolves 80 out of 100 tickets within a week, the resolution rate would be:
Resolution rate = 80/100 *100% = 80%
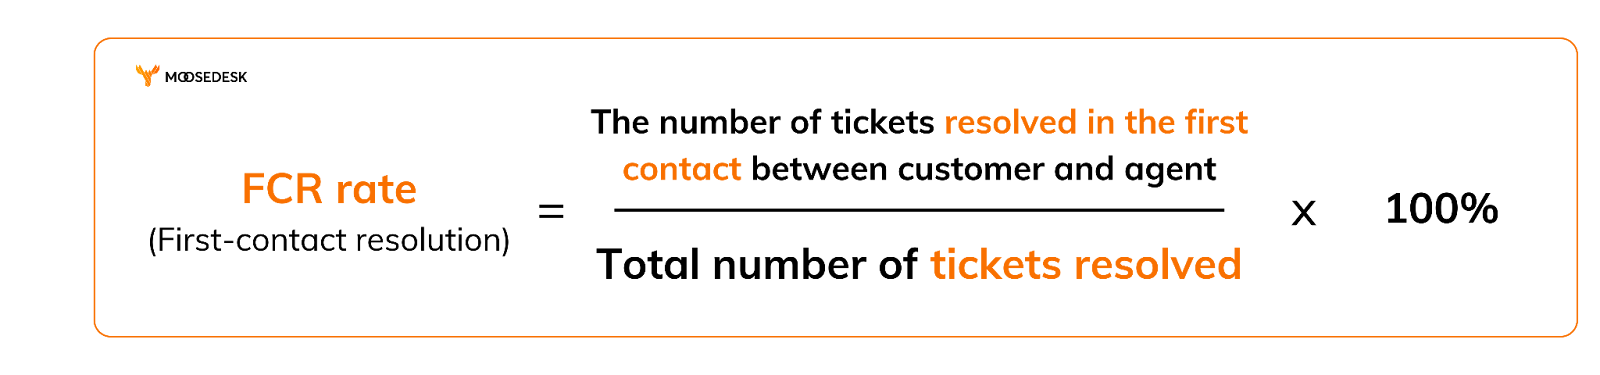
First-contact resolution (FCR) rate
First-contact resolution (FCR) rate is the proportion of customer requests resolved by a support agent or a member during the initial interaction with the customers.
FCR rate = The number of tickets resolved in the first contact between customer and agent/ Total number of tickets resolved * 100%
B. Shopify Help Desk Metrics About Performance
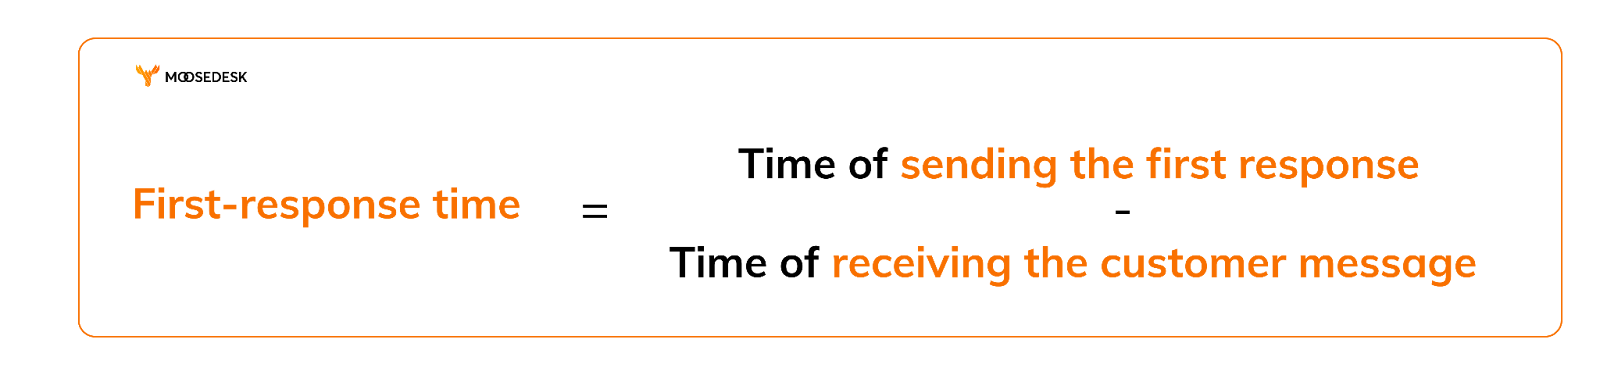
First-response time
First-response time captures how long it takes an agent to initially respond to Shopify support request or ticket. Long wait times might indicate that agents are struggling to keep up with a high volume of tickets.
First response time = Time of sending the first response – Time of receiving the customer message
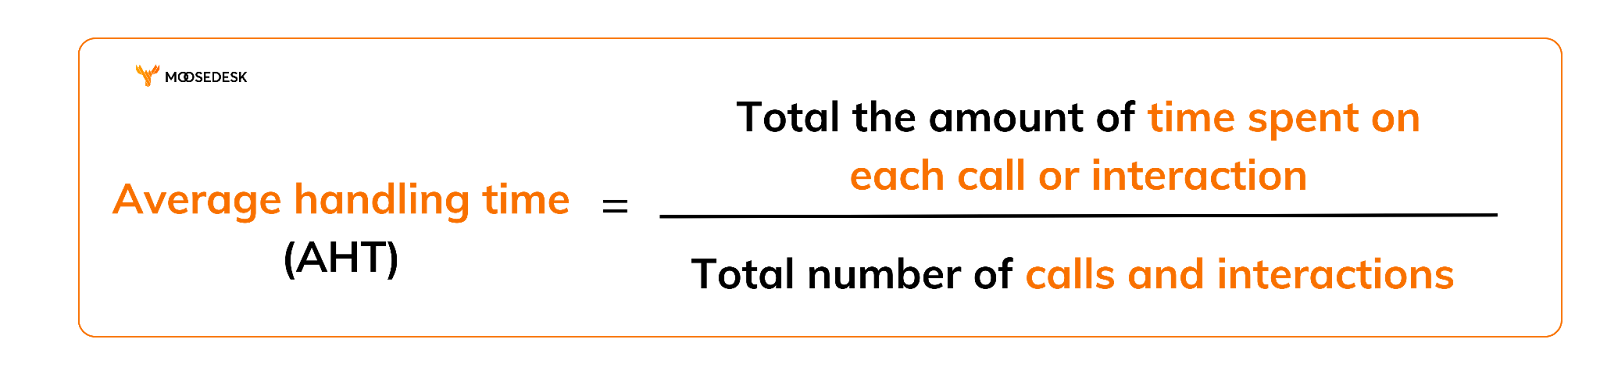
Average handling time (AHT)
Average handling time (AHT) is the average amount of time spent on a customer call or interaction. This metric serves as another indicator of your support team’s efficiency. Although longer AHTs don’t indicate an unproductive team, they might result in frustrated customers.
AHT = Total the amount of time spent on each call or interaction / Total number of calls and interactions
Resolution time
These help desk performance metrics measure the amount of time taken to completely resolve a customer issue from the moment it’s reported until it’s resolved. It tells you how long a customer must wait for a customer agent to solve their issues.
This metric includes the entire lifecycle of a ticket, including the time spent on investigation, communication with the customer, troubleshooting, and finally providing a solution.
Tracking resolution time helps evaluate the efficiency of your support team. Lower resolution times indicate faster response, problem-solving capabilities, and contributing to improved customer satisfaction.
C. Shopify Help Desk Metrics About Customer Experience
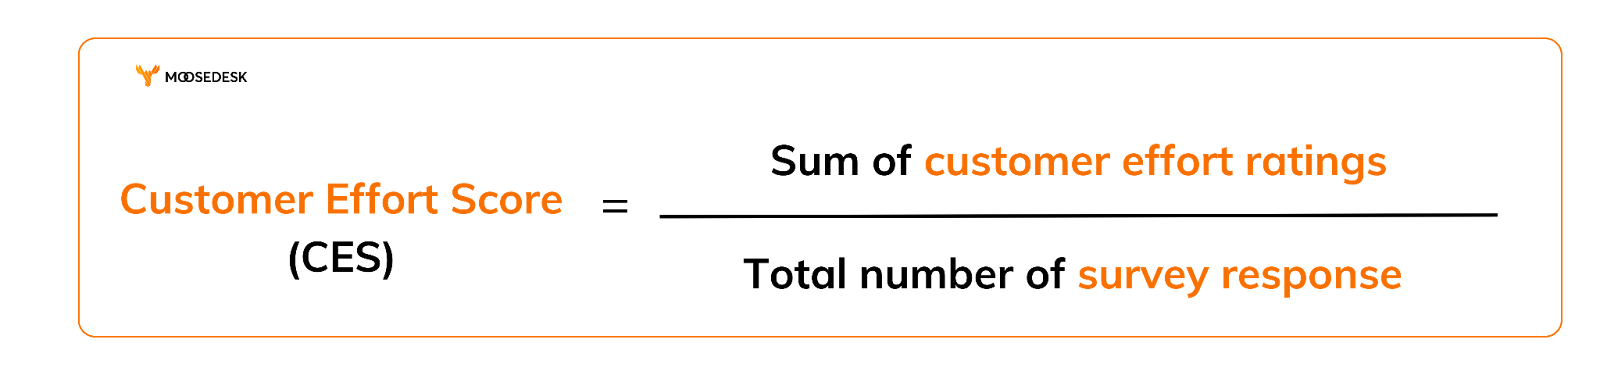
Customer Effort Score (CES)
Customer effort score (CES) evaluates how easy it is for customers to use or experience the features or functions of your products. CES is usually measured on a scale from 1 to 10.
Customer Effort Score = Sum of customer effort ratings / Total number of survey response
Net Promotor Score
Net promotor score (NPS) measures how likely customers are to recommend your products to someone else.
NPS is usually measured on a scale from 1 to 10.
- Promotors (respondents who answer 9-10) are very happy customers and will most likely recommend you to others.
- Passives (respondents who answer 7-8) are quite happy but not likely to recommend your products or services.
- Detractors (respondents who answer 6 and below) are not happy and will not encourage others to patronize your business.
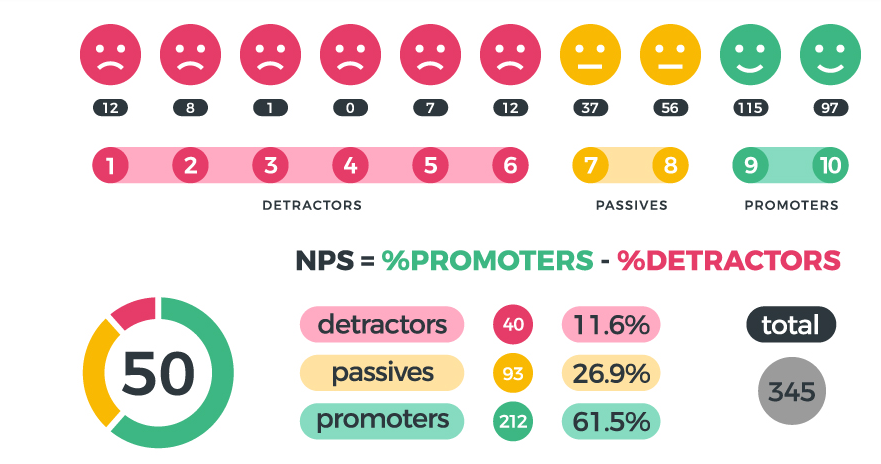
NPS evaluates the overall satisfaction and loyalty of the customers (about both support + product)
Customer Satisfaction Score (CSAT)
Customer Satisfaction Score (CSAT) measures how your customers feel about customer service or support they received. It’s typically measured by asking your customers to complete a quick survey post-service.
These help desk metrics evaluate the quality of the service provided by the support team.
According to Hiver’s benchmark survey, the CSAT score is the most critical metric for 41% of customer support teams.
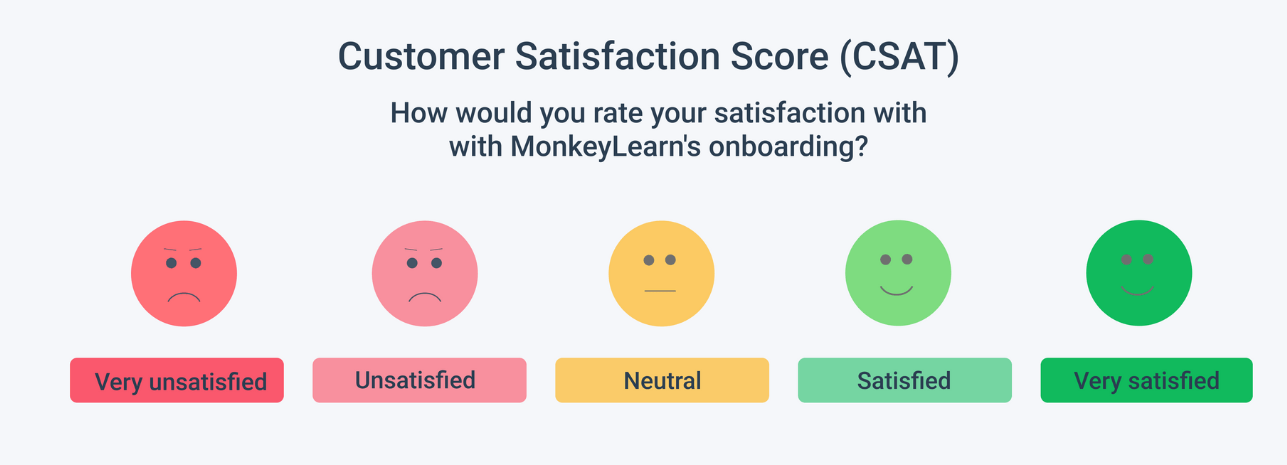
CSAT questions usually consist of concise and straightforward formats. The most common type of customer satisfaction survey example involves a rating scale question, prompting customers to rate their satisfaction on a scale of 1-5 stars.
Average CSAT can be measured on a daily, weekly, monthly, or quarterly basis.
Average CSAT = Total stars / Total surveys.

Example:
A support team received the following surveys last week.
5-star: 15 surveys
4-star: 10 surveys
3-star: 2 surveys
2-star: 1 survey
1-star: 0 survey
The average CSAT of that week: (15*5 + 10*4 + 2*3 + 1*2 + 0*1) / (15+10+2+1+0) = 4.39
How To Measure Help Desk Metrics Effectively?
Measuring help desk metrics effectively involves a combination of strategies and tools to gather and analyze data. Here are some ways you can take to measure your helpdesk metrics:
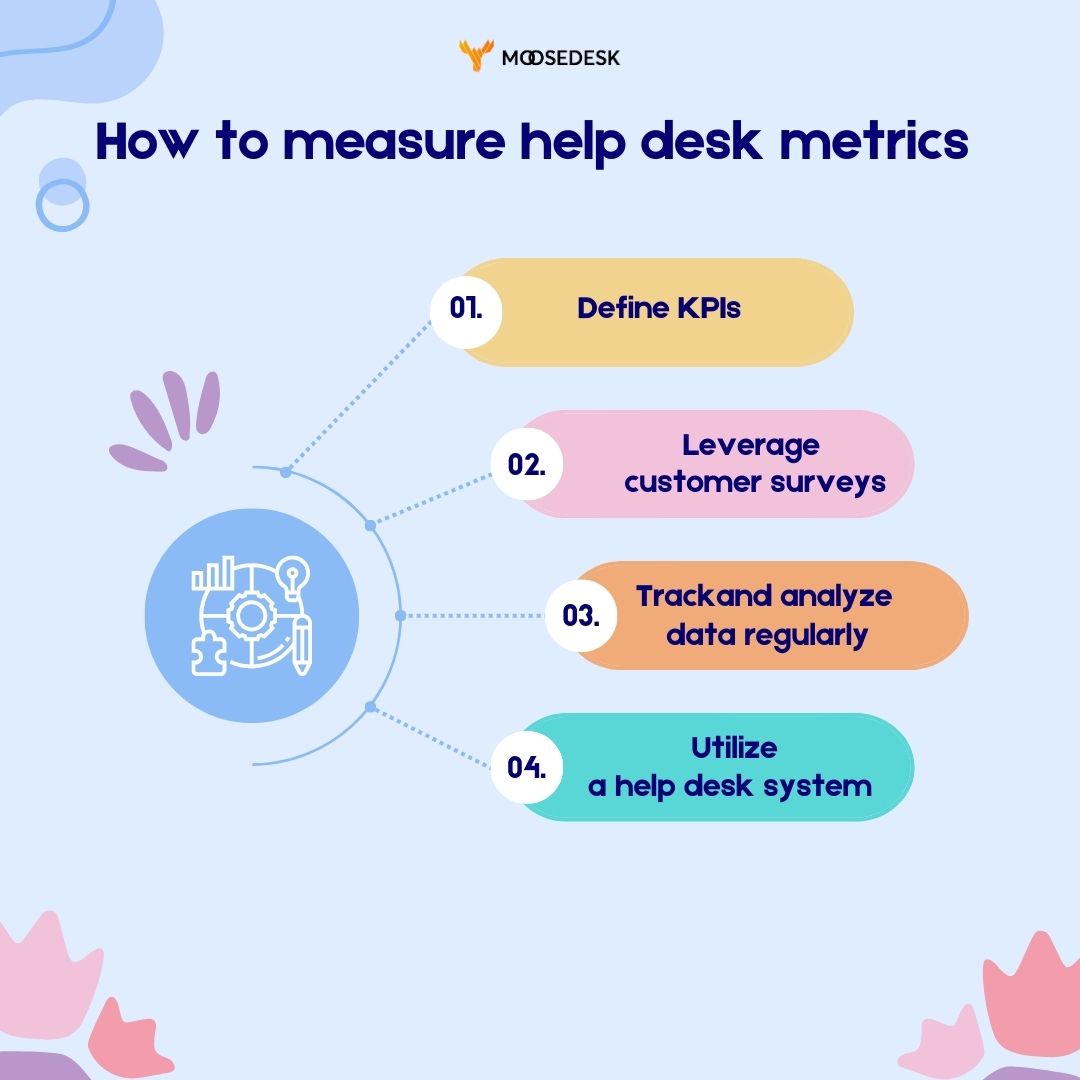
Define KPIs
To measure your metrics effectively, the first step is identifying the specific metrics that matter to your help desk operations, which may include some of the metrics mentioned earlier. Ensure that your chosen Key Performance Indicators (KPIs) align closely with your goals and objectives.
Leverage customer surveys
You can leverage customer surveys to measure help desk metrics by gathering direct feedback from customers about their experience with your product/service. You should design surveys that focus on satisfaction levels, ease of issue resolution, and overall support quality.
Track and analyze data regularly
To achieve a comprehensive view, it’s crucial to regularly export and merge data from various sources. Additionally, establishing regular intervals to review and analyze the gathered data against predetermined KPIs is vital. This helps identify trends, areas of improvement, and success within the help desk operations.
Finally, comparing your metrics with industry benchmarks or your historical data allows for setting achievable goals for improvement.
Utilize a help desk app
Implement a help desk app or ticketing system on Shopify that can automatically track and generate reports on your chosen KPIs. These apps typically provide dashboards and help desk reports that offer insights into various metrics, making it easier to track and analyze performance.
If measuring your metrics poses a challenge, explore our MooseDesk app as a solution. Not only does it aid in resolving customer inquiries efficiently, but it also furnishes comprehensive reports including a range of essential metrics.
MooseDesk’s reports offer a breakdown of key aspects of your daily support operations which helps you monitor the support metrics, performance, and gather other in-depth insights. These reports are accessible in real time and allow customization with selected help desk metrics to suit your preferences.
Check out for MooseDesk free plan – only available for Early Bird registers!

Wrapping Up
Choosing the right help desk metrics for your team can greatly improve your support strategy for future success. Not every metric suits every team, so it’s crucial to comprehend your current position in your progression.
For newcomers, metrics such as backlogs or utilization rates may not offer significant insights. Conversely, if you’re implementing an omnichannel support approach, metrics like handle time might not precisely address your specific requirements.
Assessing the metrics aligned with your team’s needs provides you with the most effective tools to navigate and plan for the future.
Discover MooseDesk for free! Sign up now and optimize your support operations with valuable insights.